
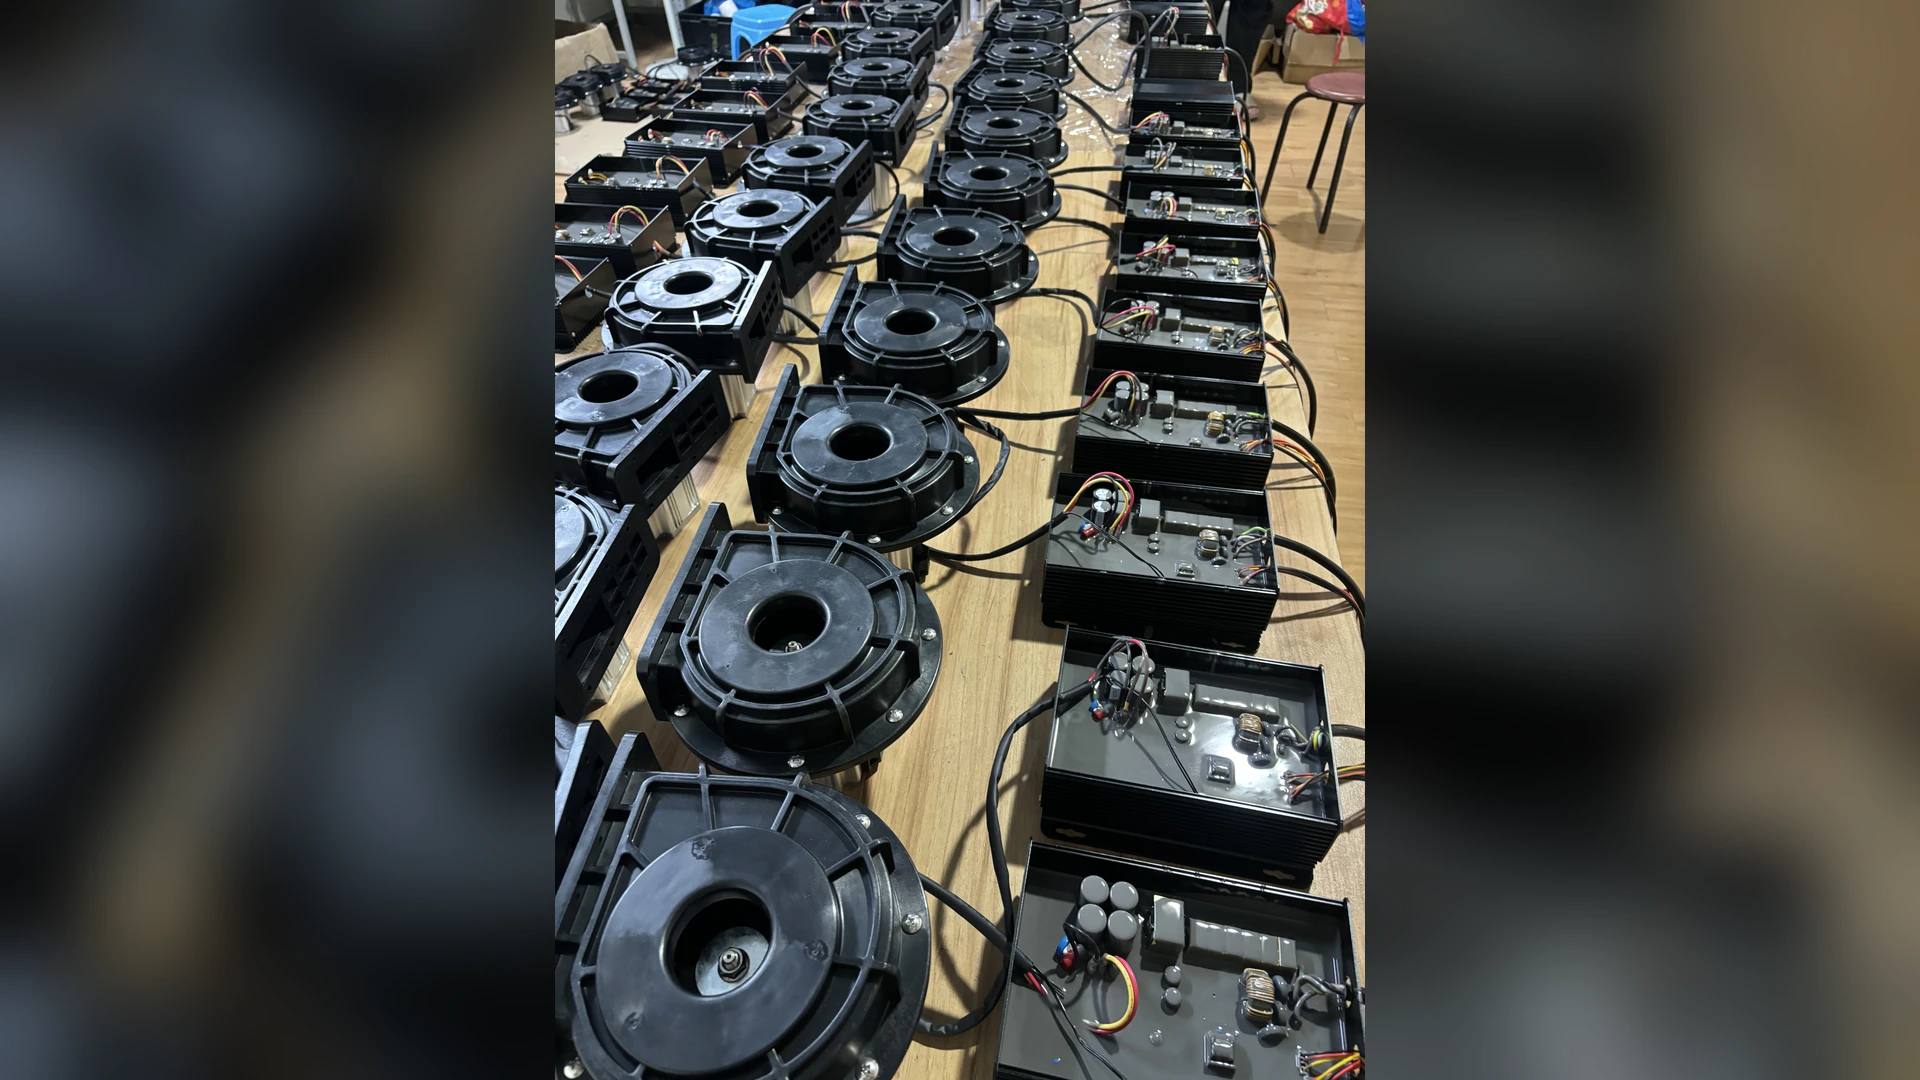
A factory test measures a blower under defined equipment, reference conditions and procedures. A site test measures the blower as part of an installed system containing filters, pipes, valves, manifolds and terminal devices. Different air density, speed settings, measurement locations, instrument accuracy and system resistance can therefore produce different readings without proving that either test is wrong.
Start by comparing like with like: the same pressure definition, airflow reference condition, blower speed and operating point. Then verify electrical supply, controls, air path and instruments. A catalogue’s maximum airflow and maximum pressure are separate endpoints, so neither should be expected together during commissioning.
What a Factory Test Actually Represents
Factory test data is intended to characterize the blower under controlled conditions. A test setup may use standardized ducts, defined measurement planes, calibrated instruments and stated inlet conditions. The resulting curve shows the relationship between airflow and pressure at a given speed or control setting.
Depending on the documentation, the data may also include electrical input, current, efficiency, noise or temperature. Each value has a test basis. Pressure may be static or total; airflow may be actual or corrected to a reference condition.
The curve is not a promise that the blower will produce every listed value after connection to any machine. It is a map of possible operating points. The installed system determines where on that map the blower operates.
The Site Adds a Resistance Curve
Once installed, air passes through components that consume pressure:
- inlet filters and silencers;
- flexible connectors;
- straight pipe and elbows;
- reducers and enlargers;
- control and isolation valves;
- manifolds and branches;
- air knives, diffusers or process vessels.
Their combined resistance increases with airflow. The intersection between this system-resistance curve and the blower curve is the actual operating point.
A factory maximum-airflow value is normally measured near low pressure. Maximum pressure normally occurs at greatly reduced airflow. Connecting a restrictive air-knife system moves the operating point away from maximum flow. This is expected behavior, not automatically a performance defect.
Reason 1: Different Pressure Definitions
A simple site wall tap usually measures gauge static pressure. A factory report may state static-pressure rise, total-pressure rise or another defined quantity between specified reference planes.
Site staff may also compare discharge pressure alone with a factory blower-pressure value. If the inlet is below atmospheric pressure because of a filter or inlet pipe, ignoring that inlet condition understates the pressure change across the blower.
Before comparing numbers, document:
- static, velocity, total or differential pressure;
- gauge or absolute reference;
- positive or negative sign;
- inlet and discharge locations;
- units and any corrections.
A precise number with the wrong definition is not a valid comparison.
Reason 2: Different Airflow Reference Conditions
Volume flow depends on density. Air temperature, atmospheric pressure, altitude and humidity can affect the relationship between actual and standardized flow.
Factory documentation may express flow at stated reference conditions, while a site meter reports actual m³/h in a warm equipment room. These numbers should not be compared until units and density basis are aligned.
Record whether flow is actual or standardized, together with reference temperature and pressure. Do not treat Nm³/h, standard cubic feet per minute and actual m³/h as interchangeable.
Reason 3: Blower Speed Is Not the Same
A factory curve applies at a stated rotational speed or control setting. The installed blower may be limited by a controller parameter, PLC command, power-quality condition or recipe.
A display showing “100%” does not always prove the same physical speed used for a published curve. Confirm actual speed or the manufacturer’s approved speed indication. Also check whether acceleration limits, temperature derating or alarm logic restrict output.
For variable-speed systems, record the command and the achieved value. A speed difference changes airflow, pressure and power together.
Reason 4: The Site Measurement Location Is Poor
Factory test sections are designed for measurement. Industrial machines often place taps beside elbows, valves, branches or reducers because those locations are accessible.
Swirl and nonuniform flow can make a one-point velocity reading inaccurate. A pressure tap on the outside of an elbow can see a local condition that does not represent average duct pressure. Flexible hose and compact manifolds may leave no suitable traverse section.
Use representative straight sections where practical and follow instrument guidance. If space prevents an ideal measurement, document the limitation or install a temporary test section for an important acceptance test.
Reason 5: Inlet Conditions Have Changed
A restrictive or contaminated inlet filter reduces available airflow and changes inlet pressure. A close wall, hot-air recirculation, undersized enclosure opening or inlet elbow can also affect performance.
Check:
- filter type, size and differential pressure;
- inlet clearance;
- cabinet ventilation;
- silencer and hose condition;
- foreign material or packaging left in the intake;
- ambient and inlet-air temperature.
Do not increase speed to compensate until the inlet path has been inspected. That response may raise electrical and thermal stress without restoring the intended duty.
Reason 6: Discharge Pipework Is Not as Designed
Site installation often differs from the proposal. A contractor may add flexible hose, substitute a smaller pipe, use tight elbows or change a manifold to fit available space. Each change affects resistance.
Air knives introduce further variables: effective slot length, gap, number of active knives and internal distribution. A 1.5 mm slot has 50% more nominal open area than a 1 mm slot of the same length, materially changing airflow demand and the system curve.
Inspect the as-built route and compare it with the selection drawing. Measure actual internal sizes rather than relying only on nominal descriptions.
Reason 7: Leaks and Unexpected Openings
Leaks can cause apparently contradictory results. Total flow near the blower may be high while useful flow at the process is low. An unused branch left open has a similar effect.
Check joints, flexible hoses, valve seats, capped ports and air-knife connections. A leak repair changes system resistance, so repeat pressure, flow and electrical readings afterward.
Reason 8: Instruments and Sampling Differ
Factory instruments are selected and calibrated for the test arrangement. Site instruments may have unsuitable ranges, overdue calibration or damaged tubing. A large-range pressure gauge may provide poor resolution at normal operating pressure.
Airflow measurement is particularly sensitive. A centerline anemometer value is not the cross-sectional average. Air-knife velocity measured at one point cannot represent the full outlet.
Check calibration, zero, units, probe alignment, averaging time and raw data. Where two instruments disagree, test them at the same point or against a known reference before judging blower performance.
Reason 9: Production Conditions Are Changing
A site test may occur while valves cycle, products change or operators adjust speed. Filter condition and incoming process load may also differ from the commissioning state.
Define a stable test condition:
- product and line speed;
- active outlets;
- valve positions;
- blower command;
- filter status;
- temperature;
- process acceptance result.
If the machine has several normal modes, test each separately rather than averaging unlike states.
A Fair Comparison Procedure
1. Obtain the correct factory documentation
Use the exact model, voltage version, speed and applicable curve. Confirm pressure and airflow definitions and stated tolerances or reference conditions.
2. Verify equipment identity and configuration
Check nameplate, controller, impeller or blower assembly where appropriate, connections and software or parameter version.
3. Document the as-built system
Record inlet components, pipe sizes, fittings, valves, branches, knife gaps and active outlets. Photograph key differences from the proposal.
4. Select comparable test points
Use approved, representative locations. Where the site cannot reproduce the factory planes, state the expected intervening losses.
5. Stabilize the machine
Confirm speed, filter condition and production state. Allow temperature and readings to settle.
6. Measure a complete data set
Record airflow, inlet and discharge pressures, electrical input, speed, temperature and process result. Preserve raw measurements.
7. Correct units and conditions
Convert flow and pressure only with stated formulas and density assumptions. Compare the site operating point with the curve rather than comparing isolated maxima.
8. Investigate the size and direction of the difference
Determine whether the difference is consistent with added resistance, density, speed or test uncertainty. Correct one issue at a time and retest.
Factory Acceptance Test vs Site Acceptance Test
A factory acceptance test can confirm blower configuration and performance under the agreed test arrangement. A site acceptance test confirms that the installed system achieves the production requirement.
These tests answer different questions. The purchase specification should state:
- measured quantities and definitions;
- test locations and instruments;
- reference conditions and conversions;
- required operating point;
- acceptable tolerance;
- process output and line condition;
- responsibilities for pipework and terminal devices.
Without an agreed method, disputes can arise from incompatible measurements rather than actual equipment failure.
Applying This to Towwind Blowers
Factory and site results can differ because test boundaries, inlet conditions, pipe resistance, speed and pressure definitions differ. Request the selected Towwind model’s released curve and exact factory test conditions before comparing the measured site duty.
If site data differs from a proposal, record actual speed or controller indication, voltage, pressure definitions, airflow method, pipe layout, active outlets and ambient conditions before changing settings. Confirm the delivered model’s usable control range and alarm limits.
For technical review, provide Towwind with model identification, applicable curve, test-point diagram, raw readings, instrument information, photos and process results. Confirm cooling clearance, controls and the final connection drawing as part of the installation review.
Performance Data and Energy Savings
Energy comparison must use equivalent air duty and production output. Measure true electrical input power where possible:
Energy use (kWh) = measured input power (kW) × operating hours
Calculate different load states separately. Comparing an existing site measurement with a factory nameplate value for the proposed unit is not a valid savings analysis.
Expected energy performance should be checked under consistent test conditions with measured real input and equivalent accepted output. The existing blower, operating point, resistance, controls and schedule determine any site-specific difference.
When the Difference May Indicate a Real Problem
Not every mismatch is explained by test conditions. Escalate the issue when:
- verified speed, density and measurement basis match, but performance remains materially outside agreed tolerance;
- abnormal current, overheating or repeated alarms occur;
- unusual vibration or mechanical noise appears;
- the blower cannot reach a previously documented baseline after external restrictions are corrected;
- controller or motor diagnostics indicate an internal fault.
Preserve evidence before resets or disassembly. Follow the final manual and involve qualified technical support rather than altering protected parameters.
Final Takeaway
Factory and site results differ because they describe different test environments unless every important condition has been aligned. The right response is not to dismiss factory data or distrust the site operator. It is to compare pressure definition, flow basis, speed, density, measurement location and the complete installed air path.
Use the factory curve as the blower reference and the site acceptance test as the process proof. When both are documented well, their apparent disagreement becomes a practical engineering diagnosis instead of a purchasing dispute.
Frequently Asked Questions
Why is site airflow lower than the catalogue maximum?
The installed system creates resistance, so the blower operates at a point with pressure and typically lower flow. Catalogue maximum airflow is usually a low-pressure endpoint.
Can site pressure be compared directly with the factory curve?
Only when pressure type, reference planes, units, speed and conditions match. A wall static-pressure reading may not equal the curve’s stated pressure basis.
Does a different site result mean the blower is defective?
Not necessarily. First check system resistance, air density, speed, electrical supply, measurement method and test locations. Escalate if a controlled comparison remains outside agreed limits.
What data should be included in a site acceptance test?
Include airflow, inlet and discharge pressure, speed, true input power, temperature, active outlets, valves, filter condition, instruments, raw readings and process result.
Can factory data be used to predict energy savings?
It can support a proposal when matched to the real duty point, but savings should compare equivalent site output using measured or supportable input power and operating hours.