
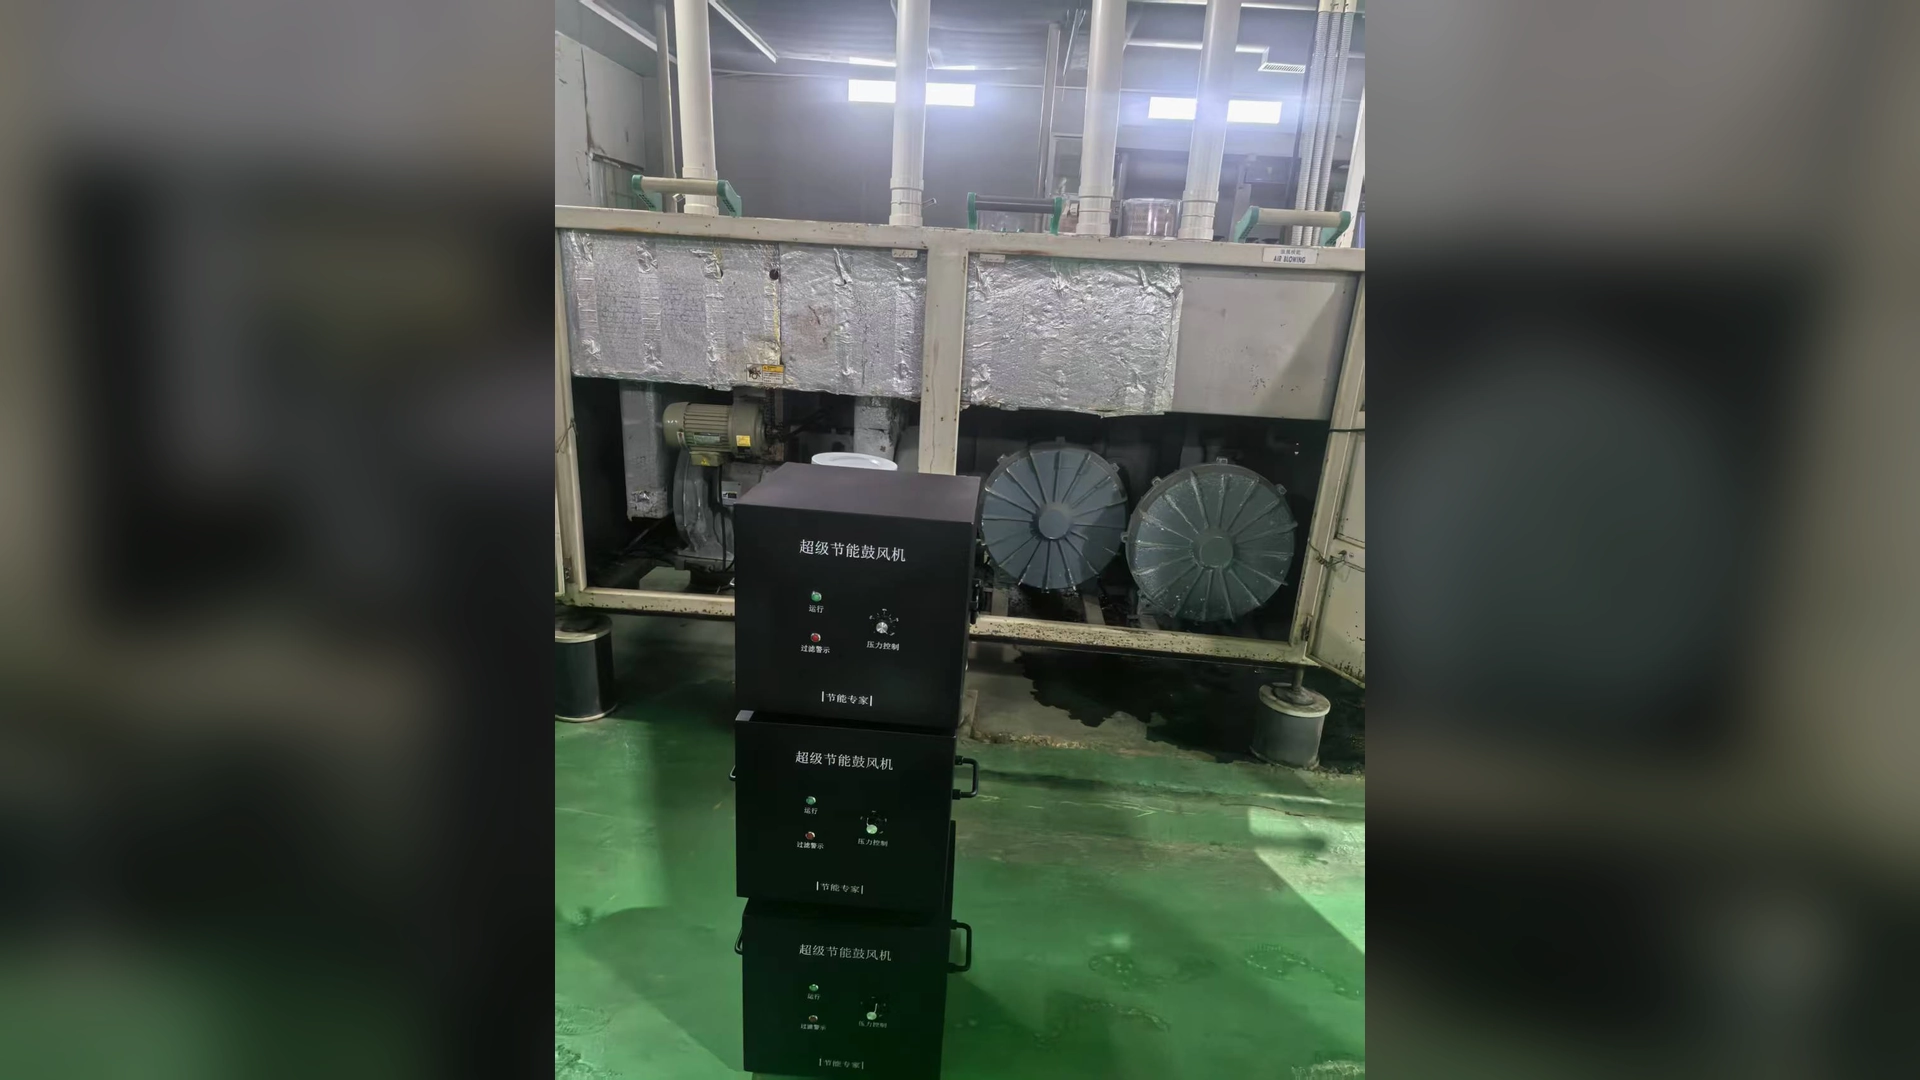
The reliable method uses measured electrical input, a representative load profile, actual operating hours and a documented process result. It also states what changed around the blower, so savings caused by new controls, repaired leaks or altered production are not incorrectly assigned to the machine alone.
Quick Answer
Measure average input power for the existing ring blower in each operating mode. Repeat the measurement after replacement at the same product, line speed, airflow, pressure and accepted quality. Multiply each mode’s power difference by its annual hours, then add the results:
Annual energy saving (kWh) = Σ [(old kW − new kW) × annual hours in that mode]
Annual cost saving = annual energy saving × applicable electricity rate
Report the baseline dates, instruments, operating conditions and exclusions. If output changes, normalize energy by accepted production before claiming a percentage saving.
Define the Measurement Boundary
Decide which electrical loads belong to the comparison. At minimum, include the blower and its controller. If the retrofit removes a bypass fan, adds cooling equipment or changes a separate heater, show those loads explicitly.
Use the same boundary before and after. A meter on the old blower motor compared with a meter on the entire new machine panel is not a fair test.
Also define the process boundary. State the point at which airflow and pressure are measured, the product and line speed, and the quality criterion. This prevents a lower-output system from appearing efficient simply because it does less work.
Establish a Representative Baseline
Measure the existing ring blower before dismantling it. Record:
- real input power, not only current;
- airflow and pressure at identified points;
- valve, bypass and damper positions;
- product, line speed and accepted output;
- hours in full, reduced and idle modes;
- filter and piping condition;
- inlet and ambient temperature where relevant; and
- maintenance issues or active alarms.
Collect enough data to include normal variation. One short reading can be distorted by an easy product, a clean filter or an unusual shift.
Correct Obvious Faults or Disclose Them
An old ring blower may operate with a blocked filter, major leak or partly closed valve. Correcting these faults can change its input and process performance. For a technology comparison, test the old system in a reasonable maintained state where safe and practical.
If the purpose is to document savings from the entire retrofit project, leave the true pre-project condition in the baseline but disclose it. State that the result includes system repair or control improvement, not only blower efficiency.
Both approaches are valid when the boundary is clear. Mixing them leads to an exaggerated product claim.
Match the Operating Point
Required airflow and pressure must be considered together. Verify the process point and add distribution losses to understand the blower duty. Maximum airflow and maximum pressure are separate curve endpoints and should never be combined as one rating.
After replacement, adjust the new blower until it meets the same accepted result. If the selected controller supports adjustment, validate each setting against pressure, airflow and process-quality readings.
If the new system deliberately improves throughput or drying quality, report energy intensity—such as kWh per 1,000 accepted units—in addition to total kWh.
Measure Real Electrical Input
Use an appropriate power analyzer or calibrated submeter. For three-phase equipment, measure all phases and real power. Current alone does not capture power factor or waveform effects accurately enough for a serious savings claim.
Allow the line to stabilize, then average over a representative interval. Capture startups if they are frequent enough to affect annual energy. Record meter model, connection point, date and averaging period.
Qualified personnel should conduct electrical measurements under site safety procedures.
Build Old and New Load Profiles
Many lines do not operate at one fixed demand. Create rows for full production, reduced speed, idle, cleaning and other repeated modes.
Example:
| Mode | Old input | New input | Annual hours | Annual saving |
|---|---|---|---|---|
| Full production | 3.2 kW | 1.4 kW | 3,000 h | 5,400 kWh |
| Reduced production | 2.8 kW | 0.9 kW | 1,500 h | 2,850 kWh |
| Idle/standby | 2.1 kW | 0.3 kW | 500 h | 900 kWh |
| Total | 5,000 h | 9,150 kWh |
These figures illustrate the method and are not a Towwind performance guarantee. Replace them with site measurements.
Calculate the Saving Percentage
First calculate annual old and new energy:
Old annual energy = Σ (old kW × mode hours)
New annual energy = Σ (new kW × mode hours)
Then:
Saving percentage = (old energy − new energy) ÷ old energy × 100%
Using the example, old energy is 14,850 kWh and new energy is 5,700 kWh. The calculated reduction is 9,150 kWh, or about 61.6%. Keep enough decimal precision in the worksheet, but do not imply measurement accuracy that the instruments and load sampling cannot support.
Convert Energy to Cost
For a simple energy tariff:
Annual cost saving = saved kWh × currency/kWh
If 9,150 kWh is saved and the marginal rate is 0.12 per kWh, the illustrative energy-cost reduction is 1,098 currency units per year.
Time-of-use and demand tariffs need separate treatment. Apply each mode to the relevant price period. A blower reduction changes demand charges only if it lowers the plant’s billed peak. Ask the energy or finance team which rate should be used.
Normalize for Production Changes
If annual production rises or falls, total energy alone can mislead. Calculate:
Energy intensity = blower energy ÷ accepted output
Compare old and new energy per accepted panel, container, square metre, tonne or cycle. Include rejects and rework. If the retrofit allows a faster line, report both total energy and energy intensity so buyers can see the operational benefit.
Include Filter Loading and Maintenance State
A clean new filter compared with a dirty old filter biases the result. Ideally, compare systems at similar documented filter condition or test each across a service interval.
Track pressure across the filter. A system with lower initial power but rapid filter loading may not sustain its advantage. Maintenance access, filter cost and replacement frequency belong in the lifecycle assessment even though they are not electrical savings.
Separate Control Savings from Hardware Savings
A replacement project may add speed control, product recipes and line interlocks. These features can reduce power during partial load and idle periods. Report them as part of the complete system benefit, but make the mechanism clear.
For example: “The annual reduction includes lower production-mode input and automatic speed reduction during 500 idle hours.” This is stronger than attributing the entire number to a motor rating.
Similarly, disclose repaired leaks, new pipe or modified air knives. Transparent attribution makes the result more transferable to other sites.
Apply Towwind Specifications Correctly
For a Towwind replacement, obtain the released pressure–airflow curve and delivered electrical/control data for the exact model. Catalogue maximum-flow and maximum-pressure endpoints are not a simultaneous duty, and conflicting source-sheet values cannot establish the installed result.
These specifications help screen a model. Final selection requires the exact airflow-pressure point on the relevant curve, plus piping, ambient, electrical and control information.
Calculate any replacement saving from the existing blower’s measured input, the new system’s input at equivalent accepted output and representative hours. Duty point, throttling, schedule and system condition determine the result.
Account for Measurement Uncertainty
Meters, airflow instruments and production data all have uncertainty. Use calibrated equipment, repeat measurements and keep test conditions as similar as practical.
If the difference between old and new power is small relative to measurement uncertainty or day-to-day process variation, extend the test. Avoid reporting a saving percentage to two decimal places unless the evidence supports that precision.
An independent meter or utility data review may be appropriate for a large capital project or performance contract.
Commissioning and Verification Plan
Agree on the test before ordering:
- Define required process performance and measurement points.
- Record the old system across representative modes.
- Preserve baseline settings and instrument details.
- Install and commission the proposed blower safely.
- Match process output and repeat measurements.
- Calculate mode-weighted annual energy and cost.
- Monitor a longer period for filter and production variation.
- Approve the final result with operations, maintenance and purchasing.
This plan avoids arguments after installation about which conditions should have been compared.
Beyond Electricity Savings
Purchasing should also record installation cost, adapters, controls, commissioning, filters, planned maintenance, spare parts and downtime. Better speed control may reduce process rejects or noise; a difficult-to-service installation may increase labor.
Keep energy savings separate from these benefits in the calculation, then combine them in a lifecycle-cost or ROI analysis. This preserves a clear audit trail.
Conclusion
The correct way to calculate ring blower replacement savings is to compare measured input under the same useful process conditions and weight the difference by real operating hours. Nameplate subtraction cannot do that.
A documented baseline, clear boundary and mode-by-mode calculation give buyers a result they can verify after commissioning. They also show whether savings came from the blower, controls, repaired system losses—or the complete retrofit working together.
Frequently Asked Questions
Can nameplate power be used to calculate savings?
Not as proof. It can support rough screening, but verified savings require measured real input power and comparable process output.
How long should power be measured?
Long enough to cover representative load variation. A steady line may need shorter sampling than a plant with many products, shifts and idle periods.
What if the new blower increases production?
Report total energy and energy per accepted production unit. This separates higher throughput from true efficiency improvement.
Should piping improvements be included in the saving?
They may be included in total project savings if disclosed. Do not describe the full result as blower-only efficiency when leaks, pipe or controls also changed.
Can a general percentage predict the site’s savings?
No. The result depends on the measured baseline, required duty, operating schedule, system condition and controls. Verify old and new energy at equivalent accepted output.