
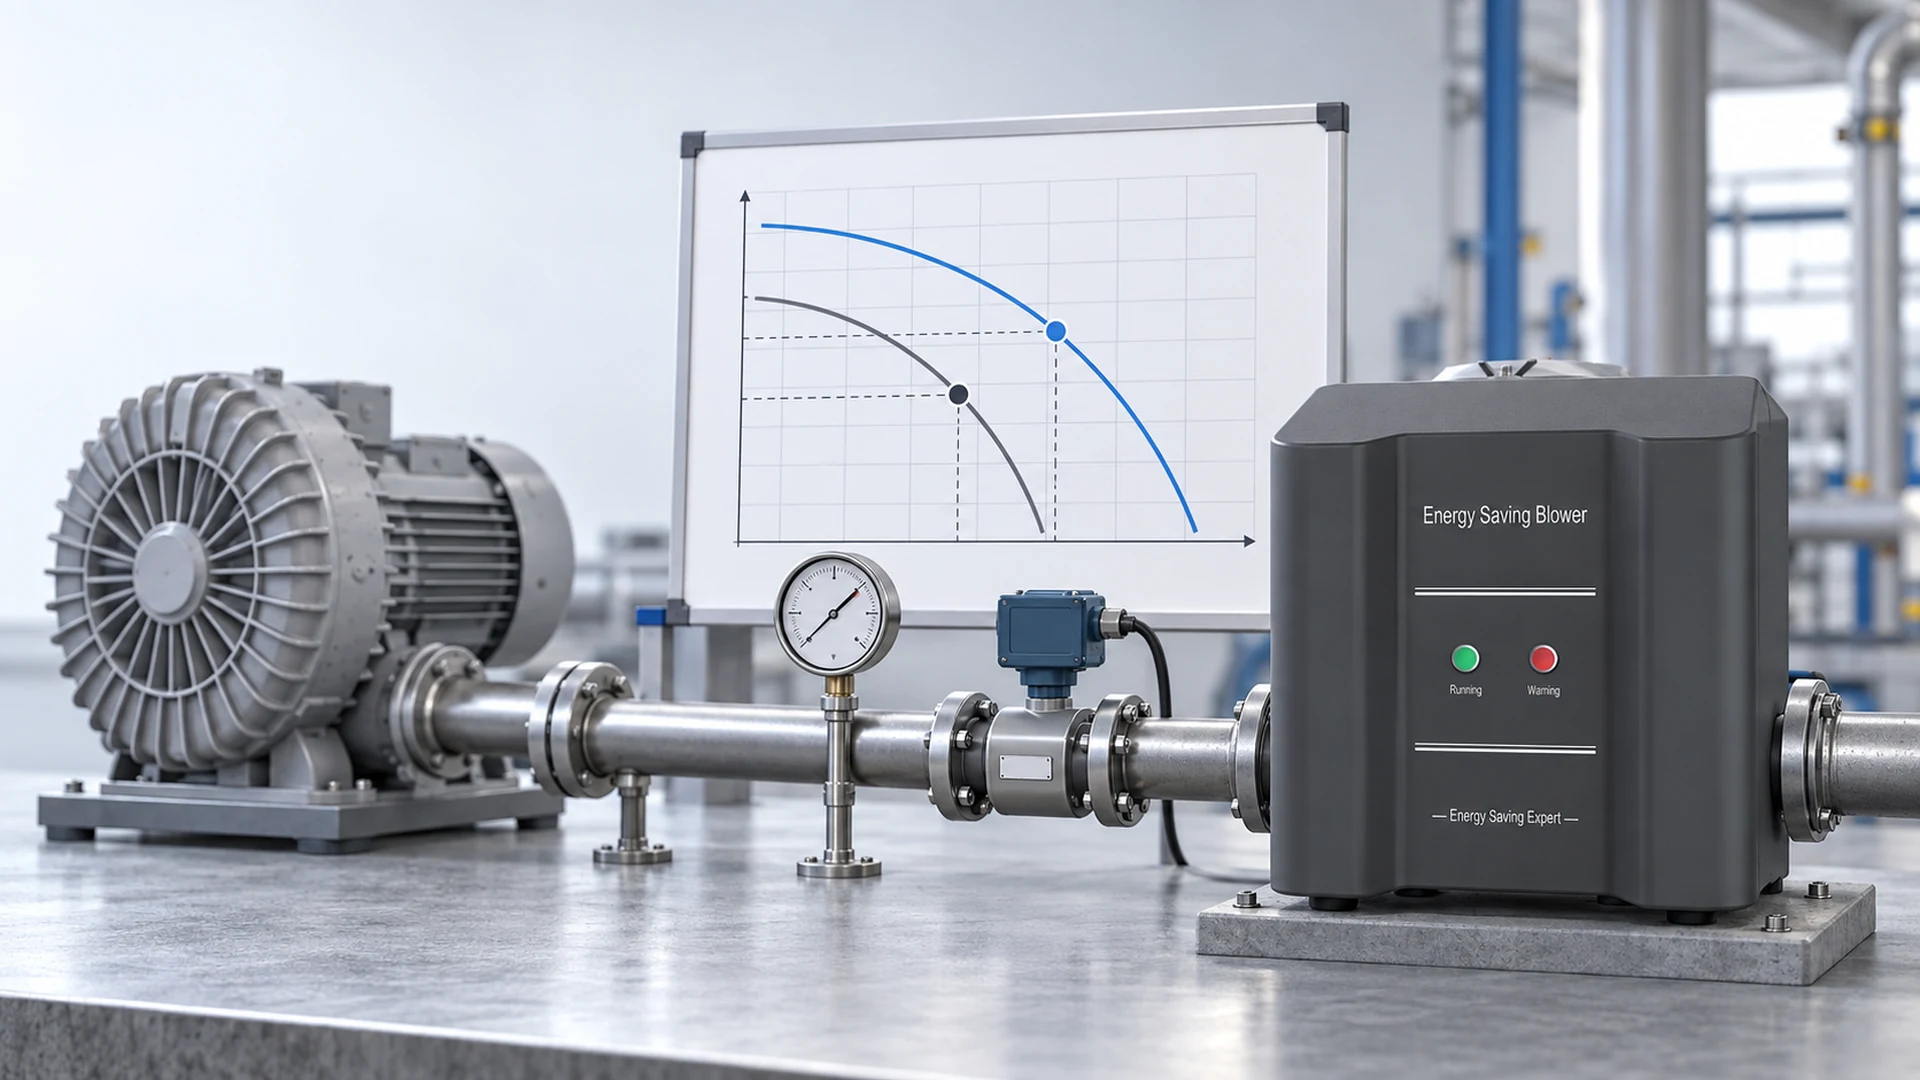
The existing blower runs a line today. A supplier proposes a replacement and marks a point on its performance curve. Both documents show airflow and pressure, yet the figures may describe different conditions. One could be a field reading at the manifold; the other could be a laboratory rating at the blower outlet. Comparing the numbers directly can lead to the wrong purchase.
To compare blower operating points, put the existing machine and the proposed unit on the same air-service basis. Identify where flow and pressure apply, what production condition they represent, and how input power is measured. If those details are missing, the comparison is not ready for a savings claim or a purchase decision.
What Counts as an Operating Point?
An operating point is the airflow delivered at the pressure the connected system imposes under a stated condition. It is not the catalogue’s maximum airflow paired with its maximum pressure; those headline values generally come from different ends of a performance curve. The point changes when a filter loads, a valve moves, a branch opens or a production recipe changes.
For the installed blower, the point is usually estimated from field measurements taken during a defined operating mode. For the proposed blower, it is usually a predicted point on the manufacturer’s curve, subject to the stated test basis and the actual installation. That difference in evidence matters. Label each number as measured, calculated, specified or supplier-predicted instead of presenting them as equally proven.
If you still need to establish the process duty itself, start with How to Define the Required Blower Operating Point. The question here is narrower: do the old and new values describe the same duty?
Build One Comparison Sheet for Both Machines
Ask the maintenance team and supplier to complete the same fields for each relevant production mode. This is more useful than attaching two catalogues to a purchase request.
| Comparison field | Existing blower | Proposed blower |
|---|---|---|
| Process mode and production rate | Record the condition when readings were taken | State the condition the proposal is intended to serve |
| Airflow | Measured value, units, location and method | Predicted flow at the stated pressure and curve conditions |
| Pressure or vacuum | Reading, sign, units, pressure type and measurement taps | Predicted value using the same reference points and pressure type |
| Air path | Filter state, valve positions, active branches and piping | Existing path retained or listed changes and allowances |
| Inlet conditions | Temperature, altitude or other relevant density information | Manufacturer’s curve basis and any corrections |
| Electrical input | Measured real kW at a defined supply boundary | Expected real kW for the full proposed package at that duty |
| Evidence | Instrument, date, duration and uncertainty | Exact model, speed/control setting, curve revision and supplier confirmation |
Do not fill an unknown cell with a convenient estimate and then forget that it is an estimate. An unanswered item is a question to resolve with the supplier or a reason to schedule another site measurement.
Align the Measurement Boundaries
First, check where the old readings were taken. Flow measured before a leaking manifold is not necessarily the flow reaching an air knife. A pressure gauge near the blower does not automatically represent pressure at the end use. If the proposed curve gives blower-discharge pressure while the process requirement is measured downstream, the intervening pipe, filter, valve and fittings must be accounted for.
Pressure labels also matter. Static pressure, total pressure and differential pressure are not interchangeable without knowing how they were measured. In a vacuum application, state whether the figure is gauge vacuum at the inlet, absolute pressure, or a pressure difference across the machine. Write the measurement locations on a simple piping sketch. That often settles a confusing disagreement faster than another round of quotations.
Next, align units and air conditions. Convert m³/h and CFM correctly, but do not treat a unit conversion as a complete normalization. A supplier curve may be based on a specified air density, inlet temperature and speed. Hot inlet air, site altitude or a different gas can affect the comparison. Ask the supplier which corrections are appropriate for its product; do not apply a generic correction without checking the model and duty.
Finally, state what sits inside the electrical boundary. A field power reading at the existing motor starter cannot be compared fairly with a proposed motor-shaft power figure. For procurement, the useful figure is real electrical input to the operating package at the comparable duty, including the controller or drive where applicable. Current in amperes alone does not establish real kW, because voltage, phase and power factor also matter.
Decide Whether the Old Point Is the Right Target
An existing point is evidence of what the site is doing, not automatically what it should do. Suppose a drying line is missing its dryness target because an inlet filter is blocked. A replacement that merely reproduces that measured low-flow condition is not an improvement, even if its electrical input is lower. Conversely, an old blower may be throttled heavily and deliver more pressure than the process needs at the blower outlet. Its measured point should not force the new selection to carry unnecessary loss.
Keep three entries separate: the existing measured point, the required process point, and the proposed predicted point. The required point should reflect an acceptable production outcome at the agreed operating condition. If the existing machine meets it, its field point can be a strong baseline. If it does not, document the gap before comparing alternatives.
For the field-data items needed to establish that baseline, see Before Replacing a Ring Blower: Record These Site Measurements. A buyer should also ask production staff whether the recorded shift was typical. A clean-filter test taken just after maintenance may not represent the later part of the service interval.
Put the Proposed Point on the Actual Curve
Request the exact model’s performance information at the proposed speed or control setting. Have the supplier mark the required flow–pressure point and show the expected electrical input at that point. A catalogue headline such as “maximum flow” or a motor kW rating does not answer either question.
Look for a reasonable operating margin, but ask what the margin covers. Extra pressure for a loading filter is different from permanently oversizing a blower to hide unknown piping losses. If the supplier changes the pipework, filter, nozzle or branch layout in its proposal, the expected system resistance may change too. The new point must then be assessed against that revised system, not silently compared with the old one. How to Check Pipework Compatibility in a Blower Retrofit covers those physical interface questions in more detail.
The distinction between a performance curve and a field result is worth keeping visible. A curve supports selection; it does not prove the installed machine will land at the marked point. Inlet and outlet arrangements, leaks, restrictions and control settings can shift field performance. Reading a curve is only the start; Reading a Blower P–Q Curve Before Choosing a Model explains what to request from the chart itself.
Compare More Than One Mode When the Line Changes Load
A single “normal” point can conceal the hardest duty or the longest-running duty. On a PCB cleaning line, for example, different nozzles or conveyor speeds may be used for different products. The highest-pressure recipe may set the model size, while a lower-load recipe may account for most annual running hours. Those are separate questions.
List the modes that materially change the air requirement: startup, steady production, changed valve positions, different active branches and filter conditions where relevant. Then ask whether the proposed unit can operate acceptably at each required point, including any controller limitations or thermal constraints in the final manual. Do not assume that a unit suitable at one point can cover every point along the site’s operating range.
For an energy comparison, attach realistic hours to each mode. If both machines provide the required process result, estimate energy mode by mode using real electrical input in kW multiplied by hours. Keep measured existing input separate from supplier-predicted proposed input until a site test confirms the latter. A promising estimate is useful for screening; it is not a verified saving.
Where Towwind Fits into the Comparison
Towwind’s energy-saving blower can be considered as a replacement for a traditional ring, regenerative or side-channel blower when the required airflow, pressure and operating conditions fit an available model. Its BLDC-based approach may reduce electrical use in a suitable application, but the product label does not establish the saving for a particular line. A fair proposal should identify the exact Towwind model and controller, mark the relevant points on model-specific performance data, and state the expected package input at those points.
For a buyer, the practical request is simple: show the existing measured duty, the required duty and the proposed duty side by side. Flag any change to the air path or process result. If the proposal relies on an estimated system loss, identify it. That makes an attractive quotation easier to evaluate and gives the commissioning team a testable target.
Turn the Comparison into an Acceptance Test
Before placing the order, agree which production modes will be tested after installation and where instruments will be placed. Record the acceptable process outcome, flow and pressure range, filter condition, control setting, voltage and real electrical input. The proposed curve point is then a prediction to check, not a substitute for commissioning.
If the replacement meets the process requirement but its pressure differs from the old reading, investigate the system rather than declaring success or failure from that number alone. A changed pipe run, corrected leak or different control strategy may explain the difference. On the other hand, lower input power with reduced air delivery is not a valid efficiency comparison.
The cleanest purchase decision is based on equivalent useful air service, transparent assumptions and a post-installation test plan. Send Towwind the existing model, site measurements, process modes, operating hours and piping details. The engineering team can then assess whether a specific Towwind option covers the required points and what still needs verification on site.
Frequently Asked Questions
Can I compare two blowers using their maximum airflow ratings?
No. Maximum airflow is not the delivered airflow at the pressure your system requires. Compare each exact model at the same defined flow–pressure duty, using the supplier’s performance data and stated air conditions.
What if the old blower’s measured point is below the process requirement?
Keep the measured point as a record of current performance, but define the acceptable process duty separately. A new unit should be selected to meet that requirement, not to duplicate an underperforming baseline.
Is motor nameplate kW enough to compare energy use?
No. Nameplate kW is not necessarily real electrical input at the working point. Measure the existing package’s real input and request the proposed package’s expected input at equivalent useful output, then verify after installation.
Should we compare only the line’s normal operating mode?
Not if other modes affect selection or annual energy use. Include the most demanding required duty and the modes that run for substantial hours. State the operating time for each mode rather than assuming a single point represents the whole year.
—
Editorial notes below — do not paste into the public WordPress article.