
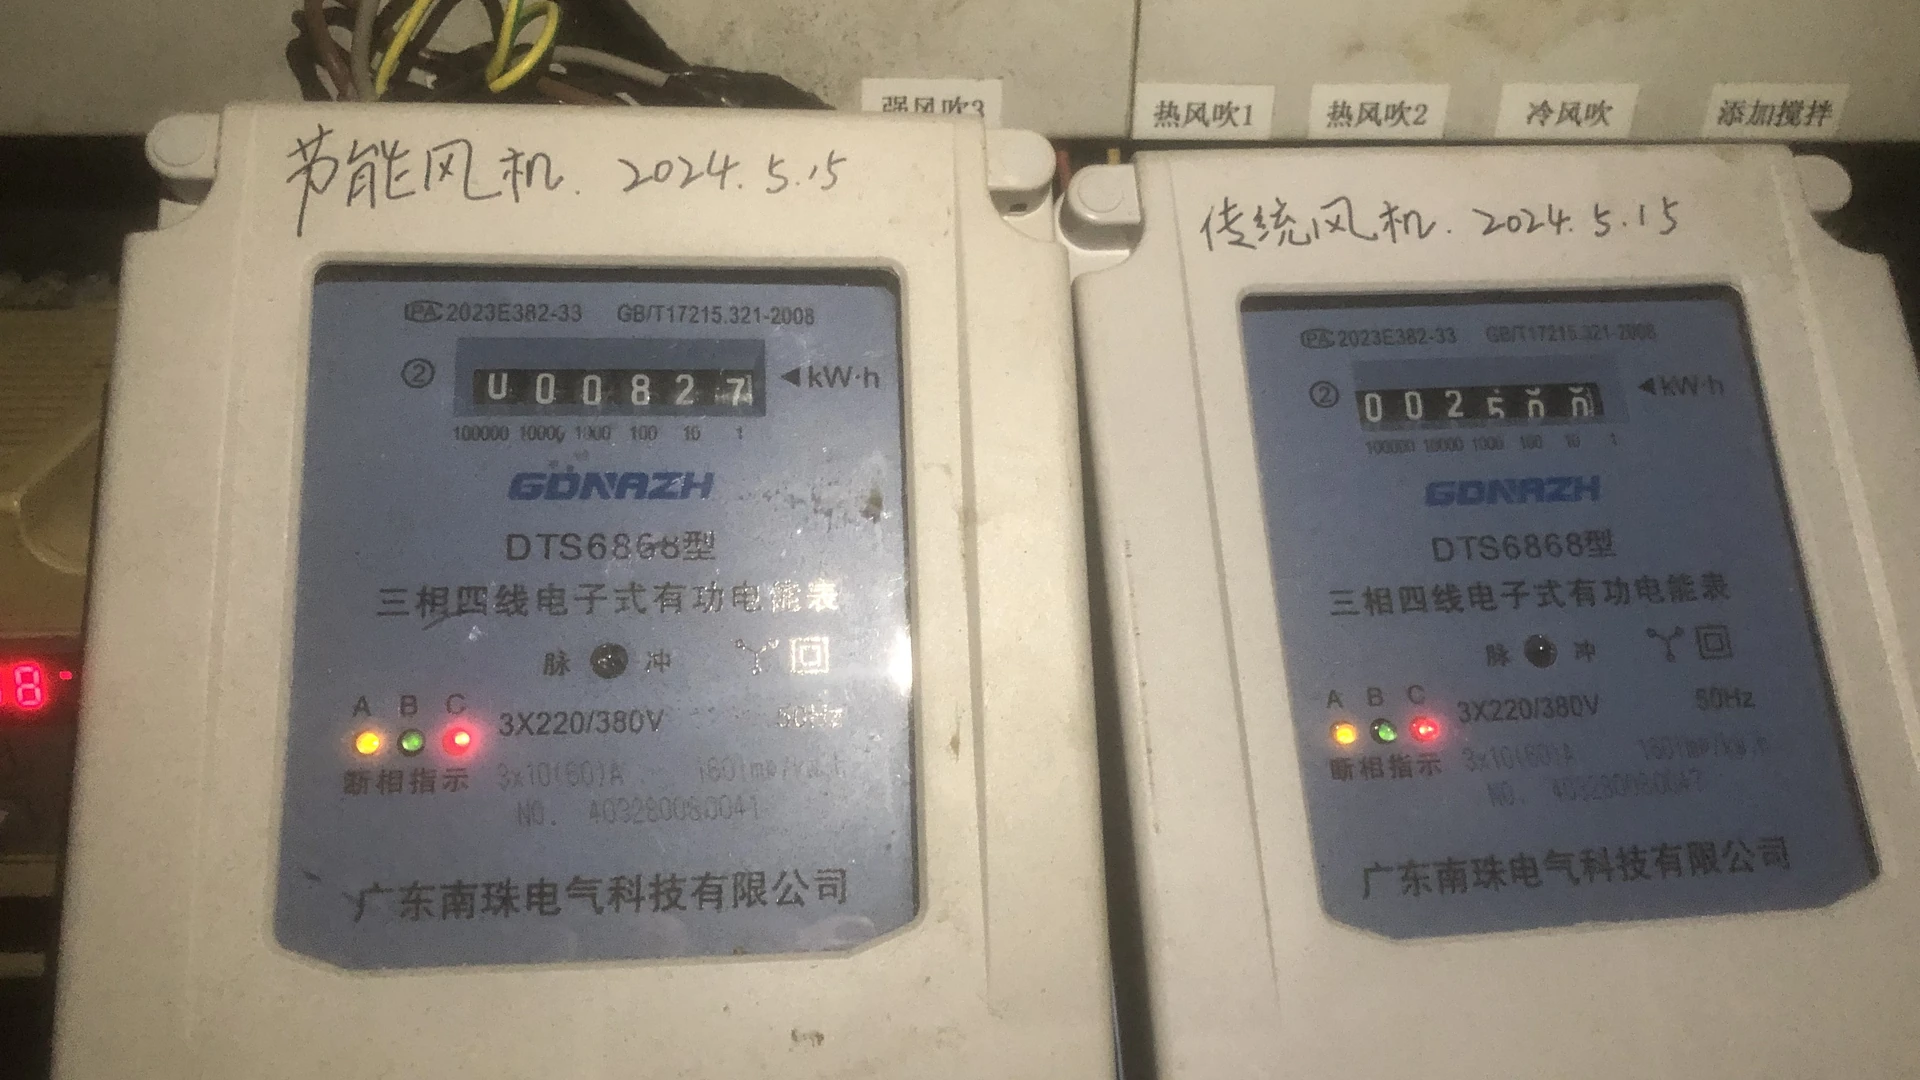
The saving is not automatic. A process with constant demand may have little opportunity, while a line with long reduced-load or idle periods may have a strong case. The correct estimate comes from a measured load profile.
Quick Answer
Variable speed can save energy when blower demand changes and the motor, blower and controller are designed for adjustable operation. Lower speed reduces airflow and pressure; under similarity conditions, power falls approximately with the cube of speed.
Use affinity laws only for initial estimates. Measure real input power at validated production settings, include controller losses and weight each mode by annual hours. Protect minimum airflow, cooling, current, temperature and process quality.
Why Fixed-Speed Systems Waste Energy
A fixed-speed blower produces according to its curve and the connected system resistance. If process demand falls, operators may close valves, open a bypass or leave air blowing at unused stations.
Throttling increases resistance but does not directly reduce source speed. Bypass air is produced and then discarded. Both methods can be necessary for protection or balance, but permanent excess capacity creates an energy opportunity.
Measure valve position, bypass flow and idle hours before assuming that opportunity is large.
How Speed Changes Performance
For the same blower under similar conditions, affinity relationships indicate:
Airflow varies approximately with speed
Pressure varies approximately with speed squared
Power varies approximately with speed cubed
At 80% speed, ideal scaling suggests about 80% airflow, 64% pressure and 51% power. This illustrates the potential but is not a guaranteed site result.
Efficiency, controller losses, air density and the actual system curve affect measured performance.
The Load Profile Determines the Annual Saving
List every repeated operating mode: full production, reduced production, changeover, cleaning, idle and shutdown. Record measured input power and hours for each.
Annual energy = Σ (average input kW in each mode × annual hours in that mode)
Compare the existing and proposed profiles mode by mode. A full-load efficiency improvement may matter less than several thousand hours of reduced-speed operation.
Runtime counters and controller logs are more reliable than an assumed shift schedule.
Variable Speed Versus Throttling
A throttle valve reduces flow by adding pressure loss. The blower continues creating pressure upstream. Variable speed shifts the blower curve so less pressure and airflow are produced.
In variable-demand service, speed control often uses less power than heavy throttling. However, some valves are still required for isolation, branch balance or process response.
Measure pressure across the valve and real input at equivalent process output. Do not remove a protective valve or bypass without reviewing blower limits.
Variable Speed Versus Bypass Control
A bypass may maintain minimum flow, protect equipment or stabilize pressure. If it stays open during normal production solely because the blower is oversized, the system pays to move unused air.
Speed reduction may close or reduce the bypass, but minimum operating conditions must be respected. Review cooling, stability and controller logic before changing it.
Record bypass position by mode so the saving mechanism remains visible in the project calculation.
Variable Speed Versus On-Off Control
Stopping a blower eliminates running power, but frequent starts may affect thermal conditions, process stability and equipment life. Some processes require continuous purge or minimum aeration.
Variable speed provides continuous modulation and can avoid repeated starts. It still consumes power at low speed and may not be the lowest-energy choice during a long approved idle period.
Compare restart time, start frequency, minimum process duty and annual schedule.
Process Quality Sets the Lower Limit
The lowest possible speed is not the target. The target is the lowest stable setting that meets the process with a justified margin.
For drying, check the hardest product location, incoming water load and line speed. For aeration, verify the relevant process response. For cleaning, inspect the required surface result.
A reduced-energy setting that creates rejects, rework or slower production is not efficient.
Pressure and Airflow Must Be Measured Together
Lower speed changes both pressure and flow. A process may appear acceptable initially but lose margin when a filter loads or another branch opens.
Record airflow and pressure at identified points for every validated recipe. Include valve positions, active outlets and filter condition.
Maximum airflow and maximum pressure are separate curve endpoints and should never be combined to predict a variable-speed point.
Controller and Motor Compatibility
An AC motor may use a VFD only when motor and blower manufacturers approve the intended frequency range. Check insulation, bearings, cooling, current and maximum mechanical speed.
Confirm the selected model’s electrical supply, controller interface and usable operating range from its current nameplate and manual; validate each production setting on the installed system.
Follow the exact wiring diagram and do not bypass protection.
Minimum-Speed Cooling
Reduced speed can lower self-cooling on some motors. Controllers also produce heat and need ventilation. Confirm minimum continuous setting and allowable ambient temperature.
Measure motor, controller and enclosure temperature during the longest low-speed mode. Keep filters and cooling paths clean and prevent hot discharge recirculation.
A wide command range does not prove continuous operation is allowed at every setting.
Control Stability
Pressure feedback can adjust blower speed automatically, but poor sensor placement or aggressive tuning can cause hunting. Oscillation wastes energy and creates unstable process air.
Choose a representative measurement point. Set ramps, deadband and control response using approved commissioning tests.
Test demand changes such as branches opening, conveyor acceleration and filter loading. Preserve a stable fallback recipe.
Recipe-Based Control
Many machines can use validated speed recipes for product family, line speed or number of active air knives. Recipe control is simpler than closed-loop pressure control when demand states are predictable.
Record speed, airflow, pressure, power and accepted result for each recipe. Restrict unauthorized changes and preserve revision history.
Update recipes after piping, air knife or filter changes because the system resistance may be different.
Interlocks and Idle Reduction
Link blower output to real production status where safe. An empty conveyor, upstream stop or planned break may permit reduced speed or shutdown.
Define delays, purge periods and restart conditions. Avoid rapid cycling caused by short process interruptions.
Measure actual nonproductive hours. Idle control can be a substantial part of project savings and should be reported separately from hardware efficiency.
Applying Towwind Product Data
Confirm the selected model’s current specification, pressure-flow curve, electrical nameplate and installation requirements before assigning an operating point.
These endpoints do not occur together. Select the model and every important speed setting from the exact curve at simultaneous airflow and pressure.
Confirm the electrical supply, controller, signals and limits for the exact selected variant from its current nameplate and manual.
Illustrative Load-Profile Calculation
Assume an existing fixed-speed system draws 3.0 kW for 4,000 production hours and 2.4 kW for 1,000 idle or reduced-load hours. A validated variable-speed system draws 1.7 kW and 0.7 kW in the same modes.
Existing annual energy is 14,400 kWh. Proposed annual energy is 7,500 kWh. The illustrative difference is 6,900 kWh.
These figures demonstrate the method and are not a Towwind performance promise. Replace them with measured site data and equivalent process output.
Verify Savings Properly
Use a suitable power analyzer or verified submeter. Measure real power, not only current, across representative production periods.
Record product, line speed, airflow, pressure, accepted output and filter condition. Normalize by accepted units when production volume changes.
Apply the correct electricity tariff to each time period. Demand-charge savings occur only when the plant’s billed peak is reduced.
Energy-Saving Claims
Variable speed may reduce input during lower-demand modes, but only if the process target is still met. Use measured site input and hours to quantify any difference.
Actual savings depend on the existing blower, operating point, load profile, piping, terminals, controller and annual hours. A constant high-demand process may achieve a different result from a variable line with long idle periods.
Publish measured conditions alongside any percentage.
Lifecycle Cost
Include blower, controller or VFD, sensors, panel work, cable, programming, commissioning, training, filters, maintenance, spares and production downtime.
Variable speed may reduce electricity and process stress, but it adds controls that need support. Compare warranty, diagnostics and replacement lead time.
Calculate simple payback and, for large projects, use the company’s discounted cash-flow method.
Commissioning Sequence
- Define process acceptance criteria and operating modes.
- Measure the existing load profile.
- Confirm motor, blower and controller compatibility.
- Correct filters, leaks and restrictions.
- Establish safe minimum and maximum settings.
- Tune ramps, recipes or pressure control.
- Measure power, airflow, pressure and temperature by mode.
- Verify the weakest product or branch.
- Test alarms, interlocks and restart behavior.
- Save approved settings and baseline readings.
This turns an adjustable blower into a controlled production asset rather than an operator-controlled dial.
Conclusion
Variable speed saves energy by reducing blower output when the process needs less air. Its value is strongest when demand varies and the existing system relies on throttling, bypass or unnecessary idle operation.
The load profile decides the annual benefit. Validate every speed against airflow, pressure, cooling and process quality, then verify savings from measured power and real hours. A properly matched control strategy can reduce energy without sacrificing production stability.
Frequently Asked Questions
Does reducing blower speed always save energy?
It generally reduces power, but actual savings depend on blower and controller efficiency, system resistance and whether the process still meets requirements.
Why is power reduction greater than speed reduction?
Under affinity-law assumptions, power varies approximately with the cube of speed. Actual performance must be verified from curves and measurements.
Is speed control better than closing a valve?
Often for variable demand, because it reduces source output rather than adding resistance. Valves may still be needed for isolation and balance.
How low can a blower run?
Use the manufacturer’s permitted range and the minimum speed that maintains cooling, stability and accepted process output.
What data proves annual savings?
Measured real power and hours by operating mode, plus equivalent airflow, pressure, product, line speed and accepted output, provide the evidence.