
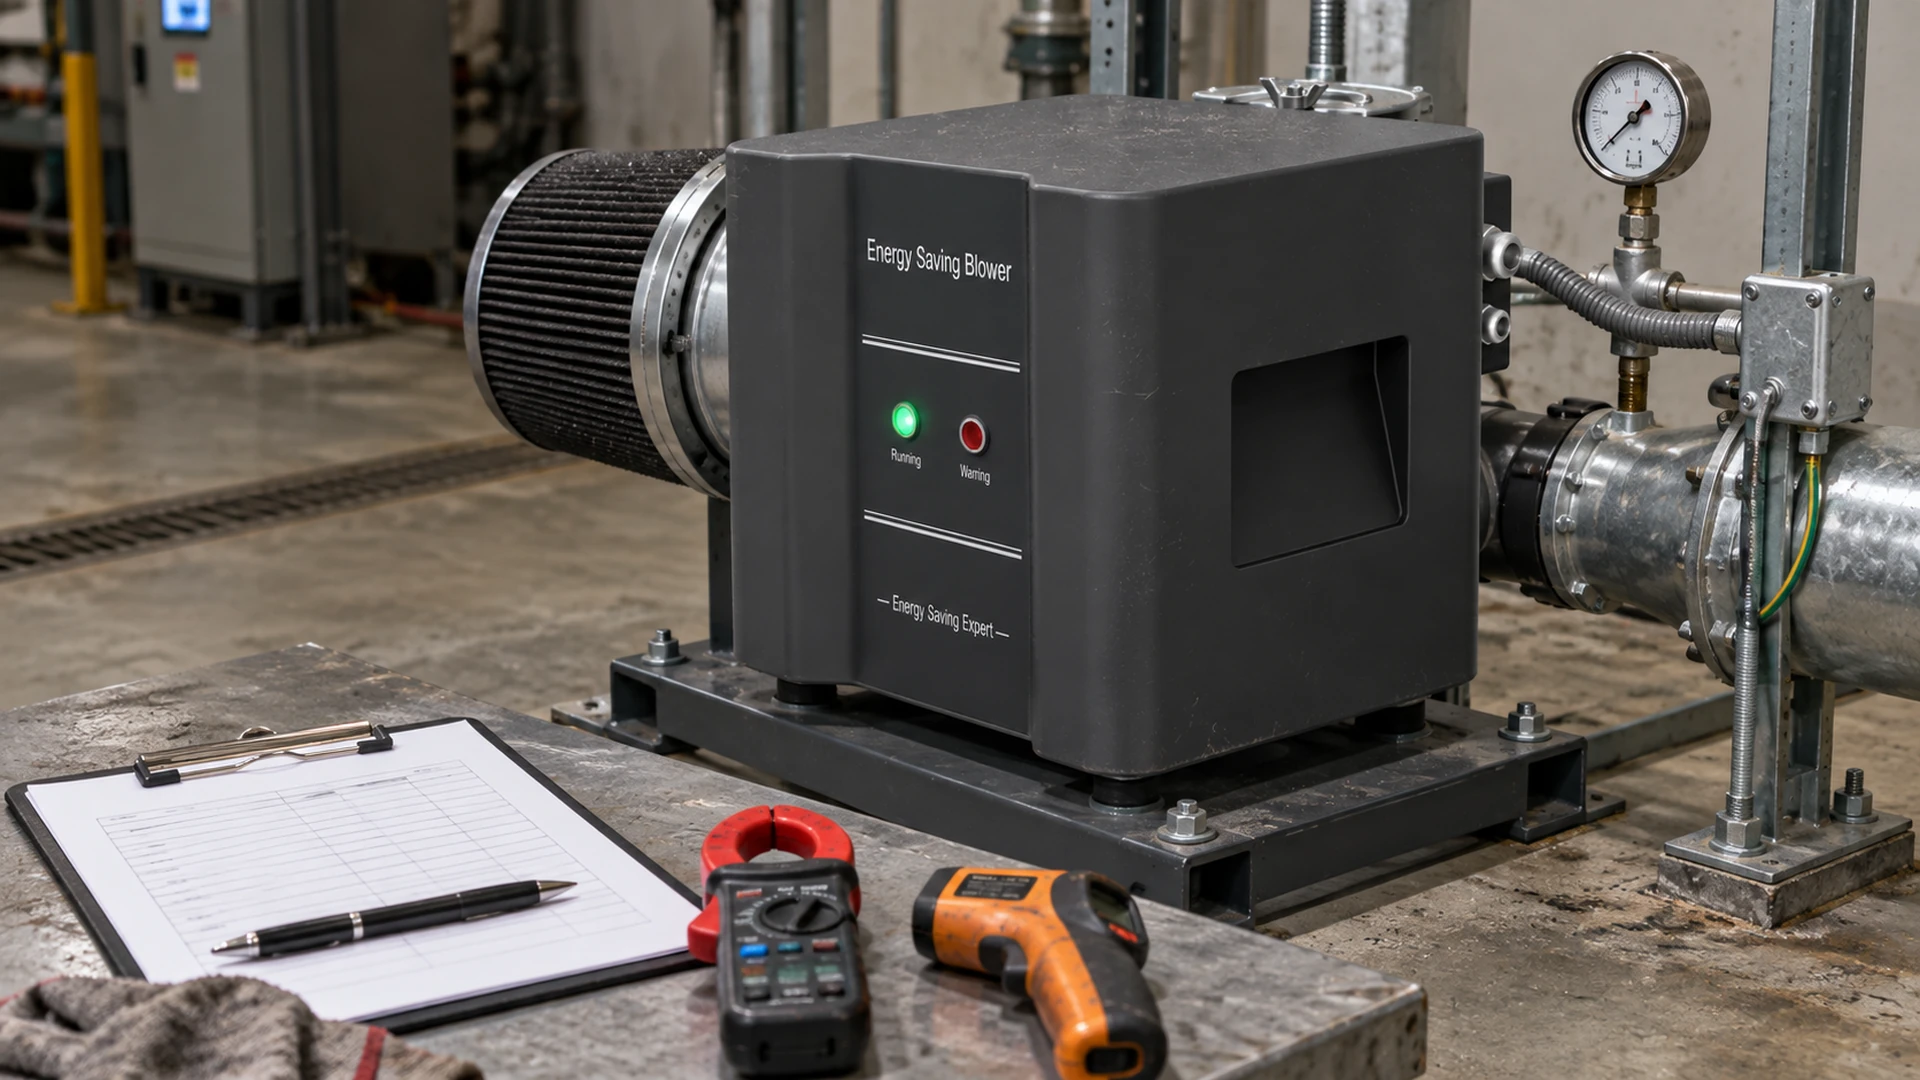
A maintenance log can contain dozens of numbers and still fail to explain why a blower’s performance changed. Pressure is written down without a measurement location. Current is compared across different production modes. “Temperature normal” appears in every row, although no one recorded where it was checked.
The most useful blower operating readings for maintenance are those that connect the machine’s operating state with its air delivery, electrical input, physical condition and process result. At minimum, record the date and mode, blower setting, pressure at named points, filter restriction where available, measured electrical input, runtime and alarms, relevant temperature or vibration data, and the result the air system must produce.
Consistency matters more than the number of columns. A short log taken at a repeatable operating condition can reveal a trend. A long list of readings gathered under changing loads may create false alarms or hide a real problem.
Begin every entry with the operating context
Before recording pressure or power, write down what the system was doing. Identify the blower, machine or line, date and time, product or process mode, control setting, open branches, valve state and filter status. Include ambient or inlet conditions when they materially affect the application or when the delivered manual requires them.
For a drying line, note the product format and line speed. For aeration, note the connected basin or branch configuration and relevant process condition. For a machine that cycles, distinguish a steady production run from idle or a brief start. These entries prevent a low-demand reading from being compared with a peak-load baseline.
Use a few defined reference modes rather than asking technicians to invent a condition on every round. For example, the site may choose one routine-production mode and one demanding normal mode. The exact choice belongs to the process owner and selected blower documentation.
Record runtime, starts and control setting
Operating hours give maintenance activities context. Record total runtime from the controller or meter where available, and note hours since a filter change or other material service. A calendar interval means little if one machine runs continuously and another runs a few hours per week.
Start count or start frequency can also matter when the selected equipment or operating schedule makes repeated cycling relevant. Do not invent a permissible number of starts; use the final manual. The log simply shows whether actual service resembles the duty used for selection.
For a variable-speed blower, record the command or actual speed indication that the site uses, with its source. If the value is a percentage or frequency rather than rotational speed, label it correctly. A pressure change after someone altered the speed setting is not the same diagnostic event as pressure changing at an unchanged setting.
Track pressure at useful, named locations
“Blower pressure” is too vague for a trend sheet. State whether the reading comes from the blower discharge, suction connection, main header, branch manifold or point near the process. Also state the pressure basis and units used by the approved measurement plan.
One reading at the blower can indicate how the unit and connected system interact, but it may not show what reaches a remote nozzle or diffuser. If the process is sensitive to downstream loss, keep a second value at a representative manifold or branch. The difference between defined points can help locate a restriction that a single gauge would miss.
Pressure must be compared at similar airflow demand and system configuration. Closing a valve can raise upstream pressure while reducing downstream delivery. A technician should not interpret the higher number as better performance without checking the process state.
Where direct airflow is measured, record the method, location and units. Do not copy catalogue airflow into a field-measurement column. If airflow is estimated from a curve or another indicator, label it as estimated and retain the assumptions.
Use filter differential pressure as a condition reading
Where the installation provides a restriction indicator or pressure points across the inlet filter, record the result at a repeatable blower setting and process mode. A rising differential pressure under comparable conditions can support a filter-service decision. The action limit must come from the exact filter or blower documentation.
Physical observations remain important. A torn element or poor seal can allow bypass and produce a deceptively low restriction reading. Add a short status field for element, housing and clean-side inspection when those checks are performed. Record the installed element part number and service date so purchasing can trace consumable use.
If the differential pressure changes suddenly, check whether airflow, valve positions or speed also changed before blaming the filter. Instrument tubing and indicators can block, leak or drift. The maintenance record should make those checks visible.
Measure electrical input at a clear boundary
For energy tracking, record real electrical input using a suitable method and state the boundary. Is the value measured at the blower package supply, controller input or another point? Does it include a separate controller or cooling accessory? Keeping that definition fixed makes later comparison more credible.
Current and voltage are useful electrical observations, but current alone is not a complete measurement of input power. Do not turn an amp reading into a precise energy claim without the additional electrical quantities and method appropriate to the system. Likewise, motor nameplate power is a rating, not routine measured consumption.
Energy use over a period is calculated from power and operating time. For equipment with several modes, record or estimate hours by mode rather than multiplying one peak reading by every annual hour. Electricity cost also requires the applicable tariff. These distinctions matter when buyers assess operating cost or compare a Towwind proposal with an existing ring blower.
Trend temperature and vibration only where the readings are meaningful
Temperature can reveal change when it is taken at the same defined location, under comparable load and with a suitable method. “Motor hot” is difficult to trend. “Ambient at the enclosure inlet” and “reading at the manual-specified location after the reference run” are more useful descriptions.
Do not create a universal surface-temperature limit for all blowers. Different motors, controllers, bearings and housings have different normal conditions and measurement points. Use the limits and alarm meanings for the delivered model. If temperature is measured only with a handheld device, keep distance, emissivity method and location consistent enough for the site’s purpose.
Vibration deserves the same discipline. A numerical trend needs a defined measurement point, direction, instrument and operating state. A comment such as “new rattling at outlet bracket” can still be useful, but it should not be compared directly with a calibrated vibration value. If the model requires formal vibration assessment, use qualified personnel and the applicable procedure.
Noise is best recorded as a specific change: when it occurs, where it is heard and whether it follows speed, valve position or production mode. A sound-level number without measurement conditions can be misleading. The aim is to help investigation, not populate a maintenance sheet with impressive-looking data.
Keep alarm history connected to the event
Record the exact alarm text or code, timestamp, blower setting, machine mode and process condition. Note what the machine did, what the operator did and whether the condition returned. “Alarm reset” is not a diagnosis.
Repeated alarms that clear after a reset can show a developing problem, an intermittent signal or an unsuitable operating state. Trend the pattern and use the final manual for interpretation. Do not substitute a generic alarm list from a different controller.
If a protection setting or control parameter is changed, record the previous value, approved new value, reason, authorizer and result. Untracked changes can make every subsequent trend comparison unreliable.
Put the process result in the same row
The blower exists to support a process. Record the result alongside its operating readings. In an air-knife line, that might be the defined dry area at a stated speed. In aeration, it should be the project-specific process indicator. In equipment cooling or cleaning, use the accepted output that the machine specification requires.
A pressure or power trend without process performance cannot show whether the system is still doing useful work. Conversely, a process result may change because the incoming load changed even while the air system remains stable. Keeping both sets of information together helps maintenance and production avoid blaming the wrong component.
Use a simple pass, fail or measured quality value only if its definition is clear. “Dry” should refer to an agreed inspection location and method. “Production normal” is too broad to support a later repair or warranty discussion.
Build a log technicians will actually complete
A practical routine sheet can fit into one table:
| Reading group | What to capture | Context needed for comparison |
|---|---|---|
| Operating state | Runtime, start count where relevant, speed or control setting | Product, process mode, open branches and valve state |
| Air performance | Pressure at named points; measured or estimated flow if available | Units, measurement location and system configuration |
| Filter | Differential pressure or indicator, element ID and inspection status | Blower setting, service date and model-specific limit |
| Electrical | Input power at a stated boundary; supporting voltage/current as needed | Included equipment, operating mode and measurement method |
| Physical condition | Defined temperature and vibration readings; specific noise or leak observations | Point, instrument, load and ambient condition |
| Controls and process | Alarm code, response, parameter change and process result | Timestamp, action taken and acceptance criterion |
Set collection frequency from the equipment manual, process criticality, runtime and site maintenance strategy. Not every value needs to be handwritten every shift. Some can come from a controller or plant historian, provided the tag meaning, units and sampling remain known. Automated data still needs review; a sensor trend is not proof that the sensor is accurate.
Define who reviews the log and what happens when a value departs from its reference range. A record that nobody checks is an archive, not a maintenance tool. Escalation thresholds should be derived from the delivered documentation and site experience, not copied from another machine.
How purchasing can use maintenance trends
Consistent records support decisions beyond daily maintenance. Buyers can see actual filter consumption, repeat alarms, service hours and periods of process instability. They can distinguish an inexpensive blower with frequent intervention from a package that costs more initially but is easier to operate and support.
When asking for a replacement proposal, share representative operating logs rather than only the old model and motor rating. A supplier can see the normal and peak modes, observed pressure, run hours, control settings and process requirements. Mark measured, estimated and unknown values separately.
Trend history also improves warranty discussions. It shows the operating state before a failure, maintenance actions and whether the air path or process changed. That is more useful than a single photograph taken after the equipment stopped.
Operating records for a Towwind Energy Saving Blower
A Towwind Energy Saving Blower may be suitable for applications currently using a traditional ring, regenerative or side-channel blower, subject to airflow, pressure, system resistance and operating conditions. After installation, its routine log should use the same basic discipline: record the actual process mode, relevant air readings, electrical input, filter condition, controller status and process result.
Use the final Towwind model and controller documents to select temperature points, alarm meanings, allowable settings and service criteria. Do not assume that readings or limits from the replaced blower carry over unchanged. Keep the commissioning baseline and approved controller settings available to maintenance.
If energy saving is being evaluated, compare complete systems at equivalent accepted process output and a clearly defined electrical boundary. Actual savings depend on duty, hours, air-path condition and the efficiency of the previous system. Routine trend data can strengthen that comparison, but it does not justify applying a generic percentage to every installation.
For technical support, send Towwind the exact model, log excerpt, controller settings, pressure locations, filter condition, alarm history and process symptom. A statement such as “power increased at unchanged speed and process mode after filter differential pressure rose” is much more actionable than “the blower uses too much electricity.”
Record less, compare better
Maintenance teams do not need every available parameter. They need a stable set of readings that explains what the blower was doing, what the air system delivered, what electricity it used and whether the process passed. Each number should have a location, unit and operating context.
Start with the commissioning baseline, define a few reference modes and review trends rather than isolated values. That makes the log useful for early fault detection, maintenance planning, supplier support and the buyer’s long-term cost decisions.
Frequently Asked Questions
What blower readings should maintenance record at minimum?
Record the operating mode and setting, runtime, pressure at named locations, filter restriction where available, measured electrical input at a defined boundary, alarms, relevant physical-condition readings and the accepted process result.
How often should blower readings be taken?
Use the delivered manual, process criticality, runtime and site maintenance plan. High-duty or critical equipment may justify more frequent or automated trending. Do not apply one interval to every blower and application.
Is motor current enough to track blower energy use?
No. Current is useful diagnostic information, but it is not automatically input power or energy. Use a suitable power measurement and multiply power by operating hours for the relevant mode when estimating consumption.
Why must pressure readings include a location?
Pressure changes along filters, valves, pipes and branches. A blower-discharge reading may not represent the pressure at a remote nozzle or manifold. Named locations make readings comparable and help locate added loss.
Can Towwind energy savings be verified from a maintenance log?
A well-designed log can support verification if it records measured electrical input and equivalent accepted process output under comparable conditions. Actual savings also depend on operating hours, system resistance and the previous blower’s performance.